Eikonal solver with Physics-Informed Neural Networks (PINNs) - Velocity gradient
In this lab of the ErSE 222 - Machine Learning in Geoscience course, we will expand the previous notebook to the case of vertical velocity gradient.
A nice property of PINNs is that the code remains almost unchanged from the case of constant velocity. The main difference here is that we need to choose a constant velocity to compute the analytical solution : our choice is to take the velocity at the source location as . Moreover, when evaluating the PDE loss term we will use the velocity gradient in this case.
%load_ext autoreload
%autoreload 2
%matplotlib inline

import random
import numpy as np
import matplotlib.pyplot as plt
import torch
import torch.nn as nn
import skfmm

from torch.utils.data import TensorDataset, DataLoader
from utils import *
from model import *
from train import *
set_seed(10)
device = set_device()No GPU available!
Parameters
# Network
act = 'ELU'
lay = 'linear'
unit = 30 # number of units for each layer
hidden = 10 # number of hidden layers

# Optimizer
opttype = 'adam'
lr = 1e-4
epochs = 1000
perc = 0.25
randompoints = True
batch_size = 256

# Weights
lambda_pde, lambda_init = 1., 10.
Geometry and initial traveltime
# Model grid (km)
ox, dx, nx = 0., 10./1000., 101
oz, dz, nz = 0., 10./1000., 201

# Velocity model (km/s)
v0 = 750./1000.
k = 0.5
z = np.arange(nz)*dz + oz
vel = np.outer((v0 + k * z), np.ones(nx)).T

# Source (km)
xs, zs = 500./1000., 500./1000.
# Computational domain
x, z, X, Z = eikonal_grid(ox, dx, nx, oz, dz, nz)
# Analytical solution
isource = (X == xs) & (Z == zs)
vsource = vel.ravel()[isource][0]
t0, t0_dx, t0_dz = eikonal_constant(ox, dx, nx, oz, dz, nz, xs, zs, vsource)
tana = eikonal_gradient(ox, dx, nx, oz, dz, nz, xs, zs, v0, k)
# Eikonal solution
teik = eikonal_fmm(ox, dx, nx, oz, dz, nz, xs, zs, vel)
# Factorized eikonal solution: t= tau * t0
tauana = tana / t0
tauana[np.isnan(tauana)] = 1./Users/ravasim/Desktop/KAUST/Teaching/MLgeoscience/CourseNotes/labs/notebooks/EikonalPINN/utils.py:57: RuntimeWarning: invalid value encountered in true_divide
tana_dx = (X - xs) / (dana.ravel() * v)
/Users/ravasim/Desktop/KAUST/Teaching/MLgeoscience/CourseNotes/labs/notebooks/EikonalPINN/utils.py:58: RuntimeWarning: invalid value encountered in true_divide
tana_dz = (Z - zs) / (dana.ravel() * v)
/opt/anaconda3/envs/mlcourse/lib/python3.7/site-packages/ipykernel_launcher.py:14: RuntimeWarning: invalid value encountered in true_divide
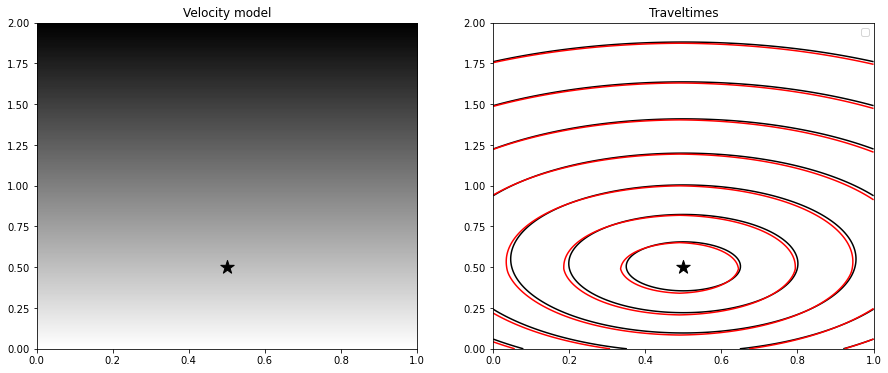
fig, axs = plt.subplots(1, 2, figsize=(15, 6))
axs[0].imshow(vel.T, extent=(x[0], x[-1], z[0], z[-1]), cmap='gray_r', origin='lower')
axs[0].scatter(xs, zs, s=200, marker='*', color='k')
axs[0].set_title('Velocity model')
axs[0].axis('tight')

axs[1].contour(tana.T, extent=(x[0], x[-1], z[0], z[-1]), colors='k', label='Analytical')
axs[1].contour(teik.T, extent=(x[0], x[-1], z[0], z[-1]), colors='r', label='Numerical')
axs[1].scatter(xs, zs, s=200, marker='*', color='k')
axs[1].set_title('Traveltimes')
axs[1].legend()
axs[1].axis('tight');
/opt/anaconda3/envs/mlcourse/lib/python3.7/site-packages/ipykernel_launcher.py:7: UserWarning: The following kwargs were not used by contour: 'label'
import sys
/opt/anaconda3/envs/mlcourse/lib/python3.7/site-packages/ipykernel_launcher.py:8: UserWarning: The following kwargs were not used by contour: 'label'
No artists with labels found to put in legend. Note that artists whose label start with an underscore are ignored when legend() is called with no argument.
Training data and network
# Remove source from grid of points to be used in training
X_nosrc, Z_nosrc, v_nosrc, t0_nosrc, t0_dx_nosrc, t0_dz_nosrc = \
    remove_source(X, Z, xs, zs, vel, t0, t0_dx, t0_dz)
# Create evaluation grid
grid_loader = create_gridloader(X, Z, device=device)# Define and initialize network
model = Network(2, 1, [unit]*hidden, act=act, lay=lay)
model.to(device)
#model.apply(model.init_weights)
print(model)Network(
(model): Sequential(
(0): Sequential(
(0): Linear(in_features=2, out_features=30, bias=True)
(1): ELU(alpha=1.0)
)
(1): Sequential(
(0): Linear(in_features=30, out_features=30, bias=True)
(1): ELU(alpha=1.0)
)
(2): Sequential(
(0): Linear(in_features=30, out_features=30, bias=True)
(1): ELU(alpha=1.0)
)
(3): Sequential(
(0): Linear(in_features=30, out_features=30, bias=True)
(1): ELU(alpha=1.0)
)
(4): Sequential(
(0): Linear(in_features=30, out_features=30, bias=True)
(1): ELU(alpha=1.0)
)
(5): Sequential(
(0): Linear(in_features=30, out_features=30, bias=True)
(1): ELU(alpha=1.0)
)
(6): Sequential(
(0): Linear(in_features=30, out_features=30, bias=True)
(1): ELU(alpha=1.0)
)
(7): Sequential(
(0): Linear(in_features=30, out_features=30, bias=True)
(1): ELU(alpha=1.0)
)
(8): Sequential(
(0): Linear(in_features=30, out_features=30, bias=True)
(1): ELU(alpha=1.0)
)
(9): Sequential(
(0): Linear(in_features=30, out_features=30, bias=True)
(1): ELU(alpha=1.0)
)
(10): Linear(in_features=30, out_features=1, bias=True)
)
)
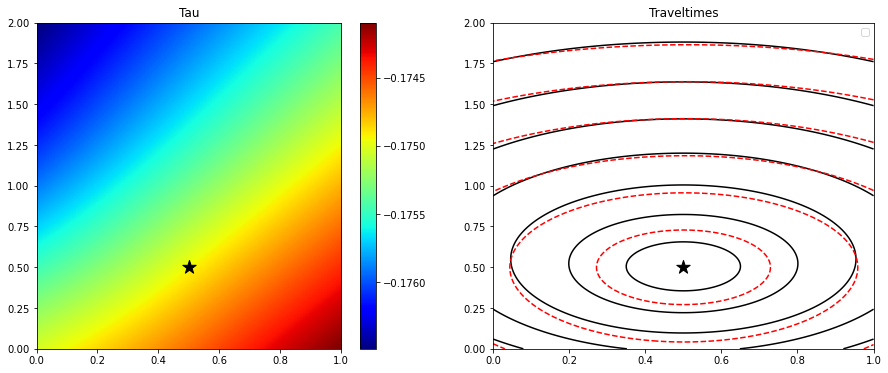
# Compute traveltime with randomly initialized network
tau_est_init = evaluate(model, grid_loader, device=device)

fig, axs = plt.subplots(1, 2, figsize=(15, 6))
im = axs[0].imshow(tau_est_init.detach().cpu().numpy().reshape(nx, nz).T,
                   extent=(x[0], x[-1], z[0], z[-1]), cmap='jet', origin='lower')
axs[0].scatter(xs, zs, s=200, marker='*', color='k')
axs[0].set_title('Tau')
axs[0].axis('tight')
plt.colorbar(im, ax=axs[0])

axs[1].contour(tana.T, extent=(x[0], x[-1], z[0], z[-1]), colors='k', label='Analytical')
axs[1].contour((tau_est_init.detach().cpu().numpy().reshape(nx, nz) * t0).T,
               extent=(x[0], x[-1], z[0], z[-1]), colors='r', label='Estimated')
axs[1].scatter(xs, zs, s=200, marker='*', color='k')
axs[1].set_title('Traveltimes')
axs[1].legend()
axs[1].axis('tight');
/opt/anaconda3/envs/mlcourse/lib/python3.7/site-packages/ipykernel_launcher.py:12: UserWarning: The following kwargs were not used by contour: 'label'
if sys.path[0] == '':
/opt/anaconda3/envs/mlcourse/lib/python3.7/site-packages/ipykernel_launcher.py:14: UserWarning: The following kwargs were not used by contour: 'label'
No artists with labels found to put in legend. Note that artists whose label start with an underscore are ignored when legend() is called with no argument.
# Compute PDE loss
pde_loader, _ = create_dataloader(X, Z, xs, zs, vel.ravel(), t0.ravel(), t0_dx.ravel(), t0_dz.ravel(),
                                  perc=1., shuffle=False, device=device)

pde, _ = evaluate_pde(model, pde_loader, device=device)

plt.figure(figsize=(7, 6))
im = plt.imshow(np.abs(pde.detach().cpu().numpy().reshape(nx, nz).T),
                extent=(x[0], x[-1], z[0], z[-1]), cmap='jet', origin='lower')
plt.scatter(xs, zs, s=200, marker='*', color='k')
plt.title('PDE Loss')
plt.axis('tight')
plt.colorbar(im);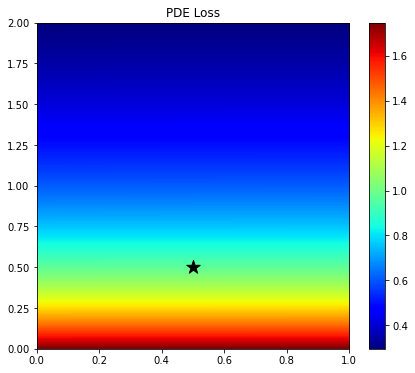
Train and compute traveltime in entire grid
# Optimizer
if opttype == 'adam':
optimizer = torch.optim.Adam(model.parameters(), lr=lr, betas=(0.9, 0.999), eps=1e-5)
elif opttype == 'lbfgs':
optimizer = torch.optim.LBFGS(model.parameters(), line_search_fn="strong_wolfe")
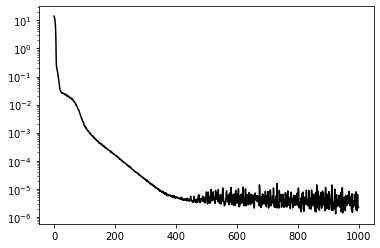
# Training
loss_history, loss_pde_history, loss_ic_history, tau_history = \
training_loop(X_nosrc, Z_nosrc, xs, zs, v_nosrc, t0_nosrc, t0_dx_nosrc, t0_dz_nosrc,
model, optimizer, epochs, Xgrid=X, Zgrid=Z,
randompoints=randompoints, batch_size=batch_size, perc=perc,
lossweights=(lambda_pde, lambda_init), device=device)
plt.figure()
plt.semilogy(loss_history, 'k');Number of points used per epoch:5075
Epoch 0, Loss 13.9093730
Recreate dataloader...
Number of points used per epoch:5075
Epoch 100, Loss 0.0017168
Epoch 200, Loss 0.0001605
Epoch 300, Loss 0.0000215
Epoch 400, Loss 0.0000049
Epoch 500, Loss 0.0000078
Epoch 600, Loss 0.0000031
Epoch 700, Loss 0.0000059
Epoch 800, Loss 0.0000026
Epoch 900, Loss 0.0000020
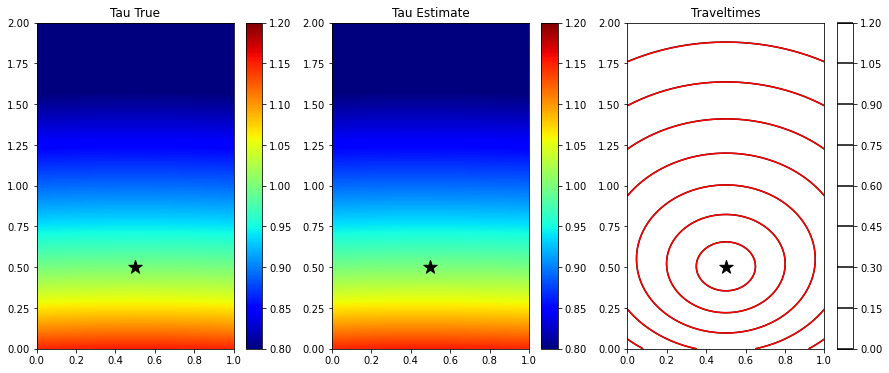
# Compute traveltime with trained network
tau_est = evaluate(model, grid_loader, device=device)

fig, axs = plt.subplots(1, 3, figsize=(15, 6))
im = axs[0].imshow(tauana.T, vmin=0.8, vmax=1.2,
                   extent=(x[0], x[-1], z[0], z[-1]), cmap='jet', origin='lower')
axs[0].scatter(xs, zs, s=200, marker='*', color='k')
axs[0].set_title('Tau True')
axs[0].axis('tight')
plt.colorbar(im, ax=axs[0])
im = axs[1].imshow(tau_est.detach().cpu().numpy().reshape(nx, nz).T, vmin=0.8, vmax=1.2,
                   extent=(x[0], x[-1], z[0], z[-1]), cmap='jet', origin='lower')
axs[1].scatter(xs, zs, s=200, marker='*', color='k')
axs[1].set_title('Tau Estimate')
axs[1].axis('tight')
plt.colorbar(im, ax=axs[1])

im = axs[2].contour(tana.T, extent=(x[0], x[-1], z[0], z[-1]), colors='k', label='Analytical')
axs[2].contour((tau_est.detach().cpu().numpy().reshape(nx, nz) * t0).T,
               extent=(x[0], x[-1], z[0], z[-1]), colors='r', label='Estimated')
#axs[2].contour(t0.T, extent=(x[0], x[-1], z[0], z[-1]), colors='b', label='Initial')
axs[2].scatter(xs, zs, s=200, marker='*', color='k')
axs[2].set_title('Traveltimes')
axs[2].axis('tight')
#im = axs[2].imshow(tana.T-(tau_est.detach().cpu().numpy().reshape(nx, nz) * t0).T,
#                   vmin=-0.001, vmax=0.001,
#                   extent=(x[0], x[-1], z[0], z[-1]), cmap='jet', origin='lower')
#axs[2].scatter(xs, zs, s=200, marker='*', color='k')
#axs[2].set_title('Error')
#axs[2].axis('tight')
plt.colorbar(im, ax=axs[2]);
/opt/anaconda3/envs/mlcourse/lib/python3.7/site-packages/ipykernel_launcher.py:18: UserWarning: The following kwargs were not used by contour: 'label'
/opt/anaconda3/envs/mlcourse/lib/python3.7/site-packages/ipykernel_launcher.py:20: UserWarning: The following kwargs were not used by contour: 'label'
fig, axs = plt.subplots(1, 3, figsize=(15, 6))
axs[0].contour(tana.T, extent=(x[0], x[-1], z[0], z[-1]), cmap='jet', linewidths=5)
axs[0].scatter(xs, zs, s=200, marker='*', color='k')
axs[0].set_title('Analytical')
axs[0].axis('tight')
axs[1].contour((tau_est.detach().cpu().numpy().reshape(nx, nz) * t0).T,
               extent=(x[0], x[-1], z[0], z[-1]), cmap='jet', linewidths=5)
axs[1].scatter(xs, zs, s=200, marker='*', color='k')
axs[1].set_title('Estimated')
axs[2].contour(t0.T, extent=(x[0], x[-1], z[0], z[-1]), cmap='jet', linewidths=5)
axs[2].scatter(xs, zs, s=200, marker='*', color='k')
axs[2].set_title('Initial')
axs[2].axis('tight');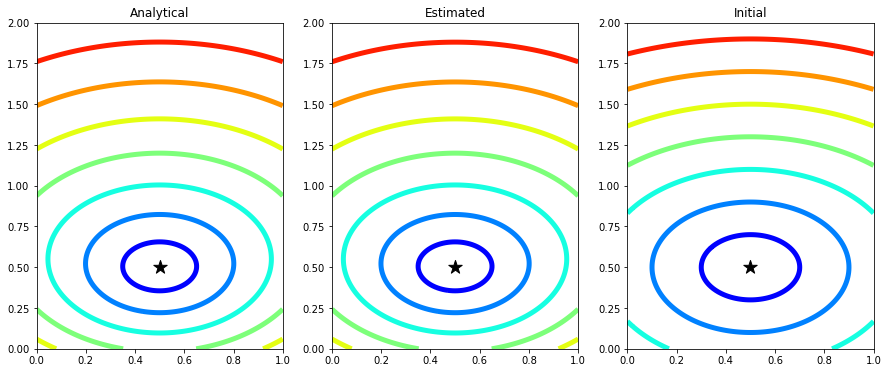
fig, axs = plt.subplots(2, len(tau_history)//2 , figsize=(len(tau_history)*2, 10))
axs = axs.ravel()

for ax, tau in zip(axs, tau_history):
    ax.imshow((tau.detach().cpu().numpy().reshape(nx, nz) * t0).T,
              extent=(x[0], x[-1], z[0], z[-1]), cmap='tab20', origin='lower', vmin=0., vmax=2.)
    ax.axis('tight')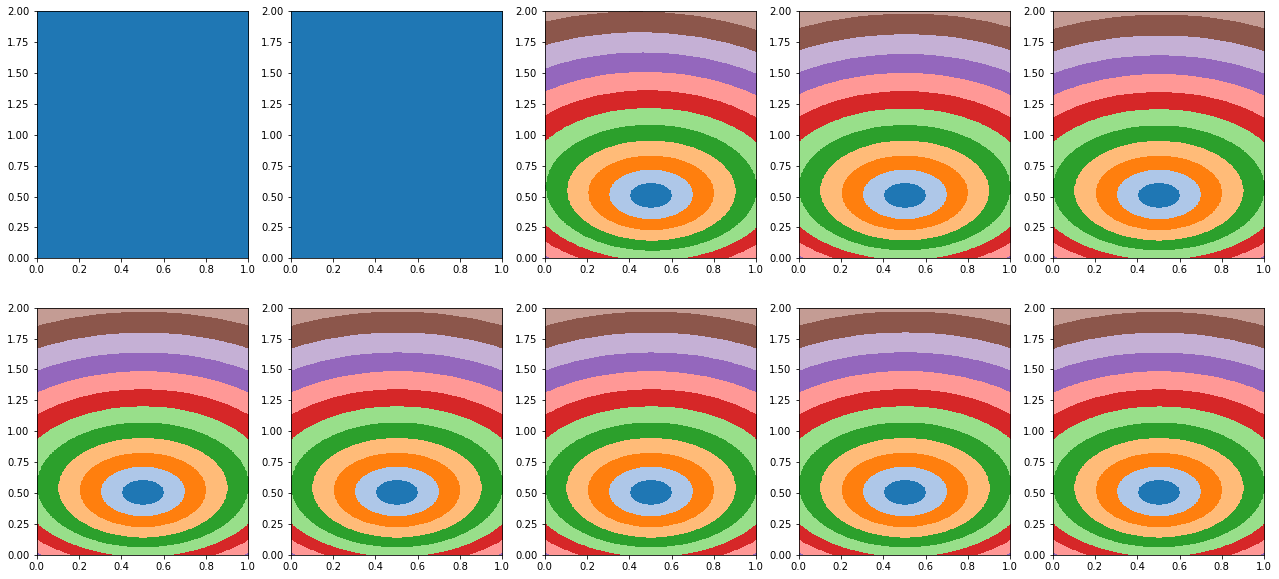
error = np.linalg.norm(tana.ravel()-(tau_est.detach().cpu().numpy().reshape(nx, nz) * t0).ravel())
print('Overall error', error)
Overall error 0.03096741208706575
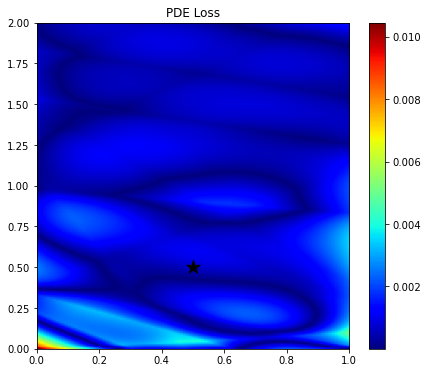
# Compute PDE loss
pde_loader, _ = create_dataloader(X, Z, xs, zs, vel.ravel(), t0.ravel(), t0_dx.ravel(), t0_dz.ravel(),
perc=1., shuffle=False, device=device)
pde, vpred = evaluate_pde(model, pde_loader, device=device)
plt.figure(figsize=(7, 6))
im = plt.imshow(np.abs(pde.detach().cpu().numpy().reshape(nx, nz).T),
extent=(x[0], x[-1], z[0], z[-1]), cmap='jet', origin='lower')
plt.scatter(xs, zs, s=200, marker='*', color='k')
plt.title('PDE Loss')
plt.axis('tight')
plt.colorbar(im);
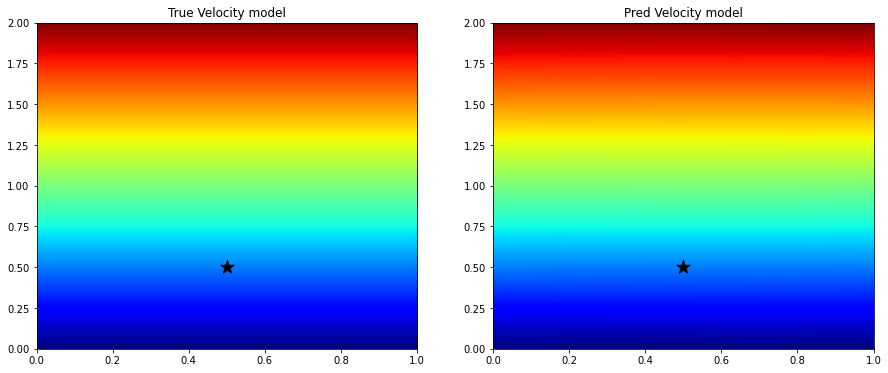
fig, axs = plt.subplots(1, 2, figsize=(15, 6))
axs[0].imshow(vel.T, extent=(x[0], x[-1], z[0], z[-1]), vmin=vel.min(), vmax=vel.max(),
cmap='jet', origin='lower')
axs[0].scatter(xs, zs, s=200, marker='*', color='k')
axs[0].set_title('True Velocity model')
axs[0].axis('tight')
axs[1].imshow(vpred.detach().cpu().numpy().reshape(nx, nz).T,
extent=(x[0], x[-1], z[0], z[-1]), vmin=vel.min(), vmax=vel.max(),
cmap='jet', origin='lower')
axs[1].scatter(xs, zs, s=200, marker='*', color='k')
axs[1].set_title('Pred Velocity model')
axs[1].axis('tight');